
What a Website That’s 3 Seconds Slower Is Actually Costing You in Conversions

Someone told you your site “needs to be faster.” But nobody told you what that is actually costing you.
You do not need a developer’s lecture on file compression. And you need the real number fast.
Because a page that loads in 1 second converts at almost 40%.
By 3 seconds, that same page converts at 29%, a drop found across more than 27,000 landing pages and over 100 million page views in Portent’s site speed analysis.
That is not a rounding error. That is roughly 1 in 4 of your potential customers, gone, before they ever read your offer.
If your web development was never built with that number in mind, it is worth 10 minutes to find out where you actually stand.
Most business owners do not distrust their site’s speed. They simply never had a reason to measure it against real conversion data instead of a generic “make it faster” note from a consultant.
Table of Contents
Your Site Is Probably Slower Than You Think
Most sites load slower than their owner assumes, because a fast connection on a work laptop hides what a real visitor on mobile data actually experiences. The average desktop site loads in 2.5 seconds, but the average mobile site takes 8.6 seconds, a gap of more than 3 times, according to Tooltester’s 2026 load time analysis.
Compare that to the sites actually winning the click. The average page ranking on the first page of Google loads in just 1.65 seconds.
That is the real target, not a vague “faster is better” goal.
| Benchmark | Load time |
| Average desktop site | 2.5 seconds |
| Average mobile site | 8.6 seconds |
| Typical first page Google result | 1.65 seconds |
| Google’s own “good” threshold (LCP) | Under 2.5 seconds |
Here is the part most owners miss. A site can pass a basic speed test and still lose visitors, because the test measures the server, not the moment a real person on a real phone decides to leave.
The gap between what a tool reports and what a visitor feels is where most lost conversions hide.

The same site, 2 different devices, and a very different load time on each. Photo: Pexels.
The Real Cost of Every Extra Second
Every extra second of load time has a real, measured conversion cost, not a vague one. Digital Applied’s April 2026 analysis puts it at roughly 1% of conversions lost for every 100 milliseconds of added load time, or about 7% lost for a full 1 second delay.
Run that against your own numbers for a moment.
A site converting 100 leads a month at a 3 second load time is not automatically doing fine at 3 seconds. It may be losing close to a third of what the same page would convert at 1 second, based on Portent’s 40% to 29% drop.
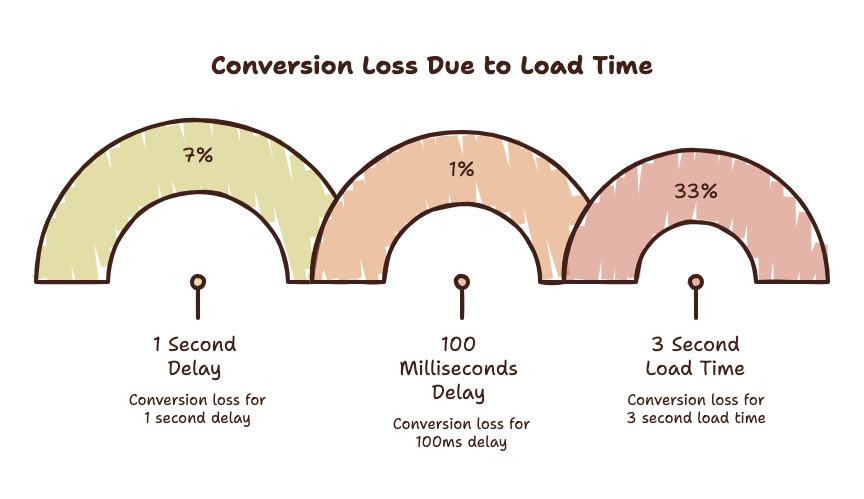
Conversion loss due to load time, the same 3 numbers from this section shown side by side.
Most business owners assume site speed is a technical nice to have, something a developer fixes when there is spare budget.
The data says the opposite. Speed is closer to pricing than to polish, because it silently sets how many visitors ever see your offer at all.
For online stores specifically, the picture is worse. Only 37% of eCommerce sites pass Core Web Vitals, the lowest pass rate of any major industry tracked, and the typical eCommerce page’s Largest Contentful Paint runs 4.8 seconds, nearly double Google’s “good” threshold, according to Digital Applied’s 2026 analysis.
That gap is estimated to cost US eCommerce businesses roughly $4.2 billion in lost revenue a year, real money, not a theoretical benchmark.
| Load time | Typical conversion rate |
| 1 second | ~40% |
| 2 seconds | ~34% |
| 3 seconds | ~29% |
The slow version and the fast version of the same page tell two different stories.
Slow: a visitor lands, waits, and leaves before your headline finishes rendering.
Fast: the same visitor reads the headline, scrolls once, and finds your form.
Same page. Same offer. One version they never see.

The wait itself, not the content, is what loses this visitor. Photo: Pexels.
Why Mobile Gets Hit Harder
Mobile visitors abandon a slow page faster than desktop visitors do, and the gap is large enough to change how a site should be built. Google’s own research found that 53% of mobile visitors leave a page that takes longer than 3 seconds to load, a benchmark from Google’s “The Need for Mobile Speed” study that is still the most cited figure in mobile performance, first published in 2016 and unchanged as the industry standard since.
The gap has not closed with better phones and faster networks. If anything, the newest performance data shows it widening.
Only 49.7% of mobile sites currently pass all 3 Core Web Vitals, compared to 57.1% of desktop sites, according to 2025 HTTP Archive Web Almanac data compiled by DebugBear.
The Mobile Penalty Compounds
A desktop visitor on a stable connection can tolerate a slightly heavier page. A mobile visitor on a train, in a parking lot, or on a spotty coffee shop signal cannot.
| Metric | Desktop | Mobile |
| Average load time | 2.5 seconds | 8.6 seconds |
| Sites passing all 3 Core Web Vitals | 57.1% | 49.7% |
The business risk is not evenly spread. If most of your traffic already comes from a phone, and for most small businesses in 2026 it does, this gap is not a technical footnote. It is the single biggest lever on your conversion rate that nobody is watching.

A real mobile visitor, on a real connection, not a lab test. Photo: Pexels.
What Actually Makes a Site Feel Fast
A site feels fast when it passes 3 specific, named metrics called Core Web Vitals: Largest Contentful Paint (how fast the main content appears), Interaction to Next Paint (how fast the page responds to a tap or click), and Cumulative Layout Shift (whether the page jumps around while loading). A site that scores well on all 3 reads as fast to a real visitor, not just to a testing tool.
INP is the newest and the one most sites are still failing. 43% of websites still fail the 200 millisecond INP threshold as of January 2026, according to a CrUX based analysis from Senorit.
That number matters because INP replaced an older, more forgiving metric in 2024. A site that passed the old test can still fail the current one, without anything on the page having visibly changed.
This is also why speed belongs inside SEO Essentials, not off in a separate technical silo. Core Web Vitals are a direct Google ranking input, so the same 3 metrics that lose you visitors also work against you in search.
A Worked Example: Diagnosing One Slow Page
- Run the actual URL through Google’s PageSpeed Insights, not just the homepage, the page a visitor actually lands on from an ad or a search result.
- Read the Core Web Vitals score first, before the general performance number, since that is the part tied directly to the conversion data above.
- Note which metric fails. A slow LCP usually means a heavy hero image. A slow INP usually means too much JavaScript running on click. A high CLS usually means ads or images loading without a reserved space.
- Fix the single worst offender first, then test again, rather than trying to fix everything in one pass.
Perceived speed matters as much as raw load time here. A page that shows real content in 1 second, even if a background script keeps loading for another 2, feels fast to a visitor. A blank white screen for 2 seconds followed by everything appearing at once feels slow, even at the identical total load time.

Reading the score that actually matters, not just the overall grade. Photo: Pexels.
What to Actually Do About It
You do not need a full rebuild to move this number. Here is the order that actually works, cheapest and fastest fixes first.
- Compress every image on your top 5 pages. This is usually the single largest fix available, and it takes an afternoon, not a developer sprint.
- Defer or remove any script your page does not need on first load, chat widgets and tracking pixels are common offenders.
- Check hosting last, a hosting upgrade helps, but only after the page itself stops sending more weight than it needs to.
- Retest the exact page a visitor actually lands on, not just your homepage, after each change.
A resource constrained founder or solo owner does not have room for a project that never ends here either. Fix the highest traffic page first, confirm the conversion number actually moves, then decide if the rest is worth the time.
jbmartyn.com itself runs on exactly this priority order, images compressed, scripts trimmed, the highest traffic pages checked first, before anything else got attention.

One page, fixed and tested again, before moving to the next. Photo: Pexels.
If you want a second pair of eyes on where your own site is actually losing visitors before they ever see your offer, email me directly or fill the form here and I will walk through your real numbers with you.
Real Questions About Website Speed and Conversions, Answered
What is a good PageSpeed score, and does it actually matter?
A good Core Web Vitals result matters more than the overall PageSpeed number: under 2.5 seconds for Largest Contentful Paint, under 200 milliseconds for Interaction to Next Paint. Only 43% of websites pass the INP threshold as of January 2026, per Senorit’s CrUX analysis. Run any page through Google’s PageSpeed Insights to see your own score.
How much does site speed actually affect conversions?
Site speed affects conversions directly and measurably, roughly 1% of conversions lost for every 100 milliseconds of added load time, according to Digital Applied’s 2026 analysis. Across a full 3 second delay, conversion rates can drop from about 40% to about 29%, based on Portent’s analysis of over 27,000 landing pages, a real, not hypothetical, revenue loss.
What makes a website feel fast to a visitor, not just test fast?
A website feels fast when real content appears within about 1 second, even if background elements keep loading afterward, because perceived speed depends on what a visitor sees, not the total technical load time. A blank screen followed by everything appearing at once feels slower than the same total time spent showing content early and loading extras quietly behind it.
Is a 1 second delay really that costly on mobile specifically?
Yes, mobile visitors abandon slow pages faster than desktop visitors do. Google’s own research found 53% of mobile visitors leave a page that takes longer than 3 seconds to load, and current 2025 to 2026 data shows only 49.7% of mobile sites pass all 3 Core Web Vitals, compared to 57.1% of desktop sites.
Do I need a developer to fix my site speed, or can I do it myself?
Most of the fastest fixes do not require a developer. Compressing images and removing unused scripts, the 2 changes covered in this post, are usually available through your website platform’s own media settings, and can move the needle before any code changes happen. I still recommend a professional pass on Core Web Vitals specifically, since INP failures often trace to a script only a developer would recognize.
How do I know if slow speed is actually costing me real customers, not just traffic?
Compare your own conversion rate at your current load time against the Portent benchmarks in this post, roughly 40% at 1 second down to 29% at 3 seconds, as your baseline. In my own audits, the pages losing the most are almost never the homepage, they are the specific landing page a paid ad or an email actually sends traffic to, so check that page first, not the one you assume matters most.